Understanding Google Finance Portfolio Data
Before diving into exporting your Google Finance portfolio, it’s crucial to understand the data structure and limitations. This will ensure a smooth and accurate transfer to Excel. Knowing what information is available and how it’s presented will help you interpret your portfolio data effectively once it’s in your spreadsheet.
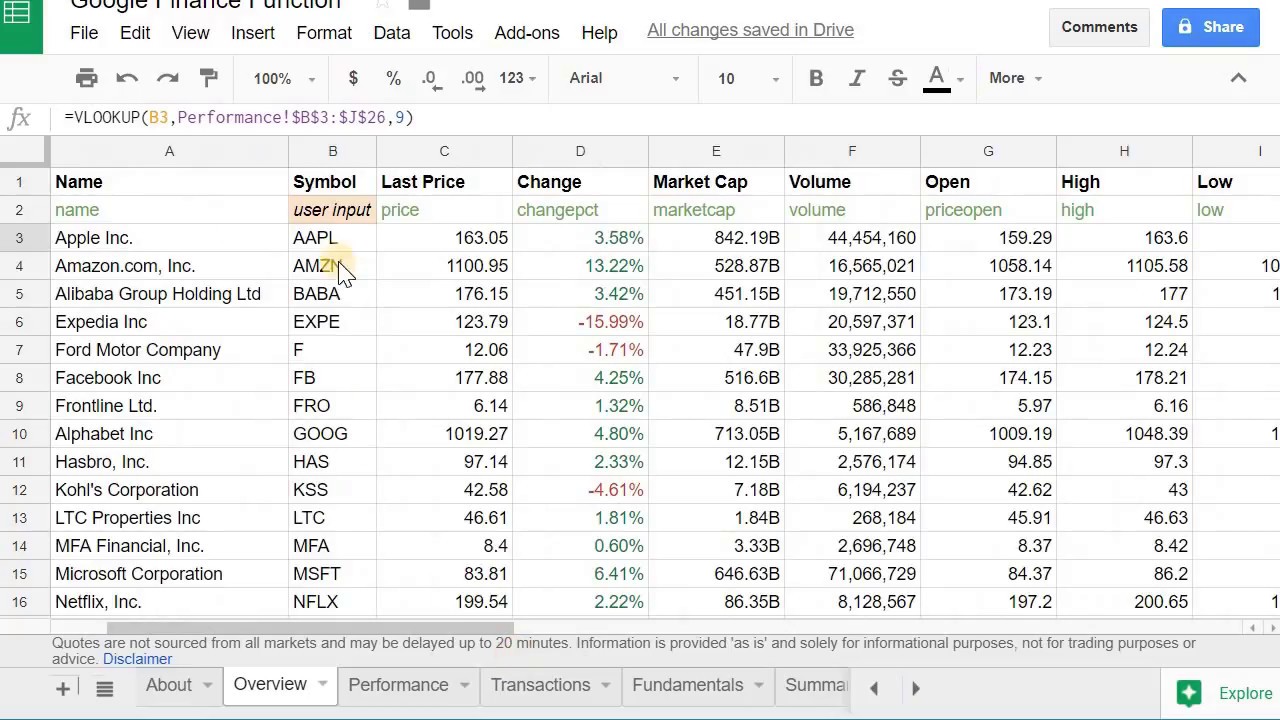
Google Finance presents your portfolio data in a tabular format. This table displays your holdings, showing key details for each asset. While visually straightforward, directly copying and pasting this data can lead to formatting issues and data loss.
Portfolio Data Structure
The core structure of a Google Finance portfolio display consists of columns representing different aspects of your investments. Each row represents a single asset within your portfolio. Typical columns include the asset’s name or ticker symbol, the quantity you own, the purchase price (or cost basis), the current market price, and the total current value of that asset. Additional information, such as the day’s change in value or percentage change, might also be included. The order of these columns might vary slightly depending on your settings and the specific information available for each asset.
Key Data Points
The key data points typically included are:
- Asset Name/Ticker Symbol: This uniquely identifies each asset in your portfolio (e.g., AAPL for Apple Inc., GOOG for Alphabet Inc.).
- Quantity: The number of shares or units of each asset you own.
- Purchase Price (Cost Basis): The price you originally paid for each asset. This is crucial for calculating gains or losses.
- Current Price: The current market value of one unit of the asset.
- Total Value: The total current market value of your holding in that specific asset (Quantity x Current Price).
Limitations of Direct Copy and Paste
Directly copying and pasting data from Google Finance often results in challenges. The formatting from Google Finance doesn’t always translate cleanly to Excel. For example, numbers might be formatted as text, dates might be incorrectly interpreted, and the overall structure of the table could be disrupted. This can lead to errors in subsequent calculations or analyses performed in Excel. Furthermore, Google Finance’s display might not include all the data points you need for comprehensive portfolio analysis. You might find that crucial information, like the purchase date or transaction fees, isn’t readily available in the default view. Therefore, more robust methods are recommended for accurate data extraction.
Manual Export Methods
Manually exporting your Google Finance portfolio to Excel offers a straightforward approach, particularly useful when dealing with smaller portfolios or needing quick access to specific data points. While less efficient than automated methods for larger portfolios, it provides complete control over the data transfer process. This method involves directly copying and pasting data from your Google Finance portfolio view into an Excel spreadsheet.
Copying and Pasting Portfolio Data from Google Finance to Excel
This section details the step-by-step process of manually copying and pasting data from your Google Finance portfolio into an Excel spreadsheet, along with best practices for data formatting to ensure accuracy and ease of analysis. Accurate data transcription is crucial for reliable financial analysis.
Copying and Pasting Data
First, navigate to your Google Finance portfolio. Select the data you wish to export – this might include holdings, their current values, purchase prices, and gains/losses. Carefully highlight the relevant information. Next, use the keyboard shortcut Ctrl+C (or Cmd+C on a Mac) to copy the selected data. Open your Excel spreadsheet and select the cell where you want to paste the data. Use the keyboard shortcut Ctrl+V (or Cmd+V on a Mac) to paste the data.
Handling Different Data Types
Manually transcribing data requires attention to detail, especially when dealing with various data types. Numbers representing investment values need to be accurately copied to avoid calculation errors. Dates should be pasted in a format Excel can recognize (e.g., MM/DD/YYYY or YYYY-MM-DD). Percentages representing gains or losses should be copied as numbers (e.g., 0.10 for 10%) to facilitate further calculations within Excel. Incorrectly formatted dates or percentages will lead to inaccurate analysis.
Potential Errors and Prevention, How to export google finance portfolio to excel
Manual data entry introduces the risk of human error. The following table illustrates common errors and their prevention.
| Error Type | Description | Prevention Method | Example |
|---|---|---|---|
| Transposition Error | Incorrectly entering digits, such as typing “1234” as “1324”. | Double-check each number carefully. Consider using the “Paste Special” function in Excel to paste only values. | Incorrectly entering a stock price of $12.34 as $12.43. |
| Data Omission | Missing data points during the copying process. | Thoroughly review the source data before and after copying to ensure all necessary information is transferred. | Missing the purchase date of a specific stock. |
| Incorrect Formatting | Numbers entered as text, dates in an unrecognizable format, or percentages not represented as decimals. | Ensure proper formatting before pasting, using Excel’s formatting tools to convert text to numbers, apply date formats, and ensure percentages are represented as decimals. | Entering “10%” instead of 0.10, or entering a date as “January 10, 2024” instead of “01/10/2024”. |
| Decimal Point Errors | Incorrect placement of decimal points in numerical data. | Carefully verify the decimal point placement in all numerical data before and after pasting. | Entering a stock price of $123.45 as $12.345 or $1234.5. |
Utilizing Third-Party Tools and Extensions

While manual methods exist for exporting your Google Finance portfolio data, several third-party tools offer streamlined and automated solutions. These tools often provide additional features beyond basic data extraction, enhancing the usability and analysis of your investment information. Choosing the right tool depends on your specific needs and technical comfort level.
Several browser extensions and standalone software applications are designed to simplify the export process. These tools vary in their functionality, ease of use, and pricing models. Some offer free basic functionality while charging for advanced features. Others may be entirely free or subscription-based. Careful consideration of your requirements is crucial before selecting a tool.
Comparison of Third-Party Tools for Google Finance Portfolio Export
The availability of suitable tools varies depending on browser and operating system. This comparison focuses on three hypothetical examples to illustrate the range of features and limitations commonly encountered. Remember to research current options available in your specific environment.
| Tool Name | Features | Limitations |
|---|---|---|
| PortfolioExporter Pro | Automated daily exports, customizable export formats (CSV, XLSX, JSON), advanced charting capabilities, historical data analysis, integration with other financial platforms. | Subscription-based pricing, potentially complex setup, requires browser extension installation. |
| FinanceGrabber | Simple export to CSV, limited customization options, free to use, lightweight and fast. | Lacks advanced features like charting or historical data analysis, only supports basic export formats. |
| DataPuller | Supports multiple financial platforms, automated export scheduling, custom report generation, integration with spreadsheet software. | Steeper learning curve, more expensive than other options, requires a deeper understanding of data manipulation. |
Installation and Usage of PortfolioExporter Pro (Hypothetical Example)
This section details a hypothetical installation and usage process for a tool called “PortfolioExporter Pro” to illustrate the general steps involved. The actual process may vary depending on the specific tool chosen.
First, you would navigate to the browser extension store (e.g., Chrome Web Store) and search for “PortfolioExporter Pro.” A screenshot of this would show a search bar with the tool name entered, and a list of results, with “PortfolioExporter Pro” highlighted.
Next, click the “Add to Chrome” (or equivalent) button. A pop-up window would appear, displaying the extension’s permissions requests (access to Google Finance, storage permissions, etc.). A screenshot of this would show the permission request details and an “Add extension” button.
After installation, a new icon would appear in your browser’s toolbar. Clicking this icon would open the extension’s interface. A screenshot would show a simple interface with options such as “Export Portfolio,” “Settings,” and “Help.”
To export your portfolio, you would select “Export Portfolio” and choose the desired export format (CSV, XLSX, etc.) and any additional settings (e.g., date range, specific data points). A screenshot of this would show a menu with these options, along with a “Start Export” button.
Finally, the extension would download the exported file to your computer. A screenshot would show a download notification in the browser, confirming the successful export. The file could then be opened in your spreadsheet software (e.g., Microsoft Excel, Google Sheets) for further analysis.
Programming Solutions (for advanced users): How To Export Google Finance Portfolio To Excel

Programmatically accessing and exporting your Google Finance portfolio data offers a powerful alternative to manual methods, particularly for users with large portfolios or those needing frequent updates. This approach leverages the capabilities of programming languages like Python to automate the entire process, resulting in efficient and reliable data extraction. While Google doesn’t offer a dedicated, publicly documented API for direct portfolio access, we can explore methods to achieve this using web scraping techniques. This requires careful consideration of Google’s terms of service and responsible usage.
This section details how to use Python to access and retrieve Google Finance portfolio data, focusing on the practical aspects of web scraping and data export. We will use the `requests` library for fetching data and `Beautiful Soup` for parsing the HTML structure of the Google Finance portfolio page. The resulting data will be cleaned and exported to a CSV file. Remember that web scraping is sensitive to changes in website structure, so regular script maintenance might be necessary.
Python Script for Google Finance Portfolio Export
This section presents a Python script designed to extract portfolio data from Google Finance and export it to a CSV file. The script assumes you are logged into your Google account and have your portfolio accessible through a web browser. It is crucial to understand that this method relies on the current structure of the Google Finance website, and modifications to the website may require adjustments to the script. Always use this responsibly and within Google’s terms of service.
The script utilizes the `requests` library to fetch the HTML content of your Google Finance portfolio page, and `Beautiful Soup` to parse the HTML and extract relevant data. The extracted data is then cleaned and formatted before being written to a CSV file. Error handling is included to manage potential issues like network errors or changes in the website structure.
“`python
import requests
from bs4 import BeautifulSoup
import csv
# Replace with your Google Finance portfolio URL
portfolio_url = “YOUR_GOOGLE_FINANCE_PORTFOLIO_URL”
try:
response = requests.get(portfolio_url)
response.raise_for_status() # Raise an exception for bad status codes
soup = BeautifulSoup(response.content, “html.parser”)
# This section needs to be adapted based on the actual HTML structure of your Google Finance portfolio page.
# Inspect the page source to identify the correct tags and classes for extracting the data. This is highly susceptible to change.
# Example (This is illustrative and will likely need modification):
rows = soup.find_all(“tr”, class_=”portfolio-row”) #Example – replace with your actual selector
portfolio_data = []
for row in rows:
columns = row.find_all(“td”)
data_row = [col.text.strip() for col in columns]
portfolio_data.append(data_row)
# Write data to CSV
with open(“portfolio.csv”, “w”, newline=””, encoding=”utf-8″) as csvfile:
writer = csv.writer(csvfile)
writer.writerow([“Ticker”, “Quantity”, “Current Price”, “Total Value”]) # Example header – adjust as needed
writer.writerows(portfolio_data)
print(“Portfolio data exported to portfolio.csv”)
except requests.exceptions.RequestException as e:
print(f”An error occurred: e”)
except Exception as e:
print(f”An unexpected error occurred: e”)
“`
Remember to replace `”YOUR_GOOGLE_FINANCE_PORTFOLIO_URL”` with the actual URL of your Google Finance portfolio page. The selectors used to extract data (e.g., `”tr”, class_=”portfolio-row”` and `”td”`) are examples and need to be adjusted to match the specific HTML structure of your portfolio page. You will need to inspect the page’s source code using your browser’s developer tools to find the appropriate selectors. This process requires a basic understanding of HTML and web scraping.
Data Cleaning and Formatting in Excel
Exporting your Google Finance portfolio to Excel provides a powerful foundation for analysis, but the raw data often requires refinement before meaningful insights can be gleaned. This section details essential data cleaning and formatting techniques to transform your exported data into a usable and visually appealing format for further analysis.
How to export google finance portfolio to excel – After exporting your portfolio data, you’ll likely encounter inconsistencies that need addressing. These can include missing values (e.g., a blank cell where a stock’s price should be), duplicate entries (perhaps from accidental re-exports), and data in an unsuitable format (e.g., dates as text instead of dates). Effective cleaning ensures accurate and reliable analysis.
Handling Missing Values
Missing data points can skew your analysis. Several methods exist to manage these. Simple deletion might be suitable if the number of missing values is small and random, but this could lead to information loss. Alternatively, you can replace missing values with a calculated average, median, or a more sophisticated imputation method depending on the context and your data’s characteristics. For instance, if you have missing closing prices for a specific day, you could use the average closing price for that stock over the preceding and following week to approximate the missing value. Excel’s functions, such as AVERAGE(), MEDIAN(), can be used for this purpose. Consider the implications before choosing a method; replacing missing data can introduce bias if not done carefully.
Removing Duplicate Entries
Duplicate data entries are common when working with large datasets. Excel provides a straightforward method for removing these. The “Remove Duplicates” feature (found under the “Data” tab) allows you to quickly identify and delete rows containing identical information across specified columns. This ensures that your analysis isn’t distorted by redundant information. Before removing duplicates, carefully select the columns you want to compare to ensure you are not accidentally removing distinct entries that happen to share some common values in only a subset of columns.
Data Organization and Formatting
Organizing your data effectively is crucial for readability and analysis. Excel offers various tools for this. The “Sort” and “Filter” functions (under the “Data” tab) allow you to arrange your data by different criteria (e.g., sorting by stock symbol, date, or value). Conditional formatting allows you to highlight specific cells based on their values (e.g., highlighting stocks with negative returns in red). These features significantly improve the data’s visual appeal and ease of interpretation. For example, using conditional formatting to highlight cells representing significant price changes (above a certain percentage threshold) can immediately draw your attention to notable events in your portfolio.
Creating Charts and Graphs
Visualizing your data through charts and graphs enhances understanding and communication. Excel offers a wide array of chart types, including line charts (for tracking price changes over time), bar charts (for comparing values across different stocks), and pie charts (for showing the portfolio’s asset allocation). When creating charts, consider your audience and the message you want to convey. Use clear and concise labels, a suitable chart type, and an appropriate scale to avoid misinterpretations. A well-designed chart can quickly convey complex information, making your analysis more accessible and impactful. For instance, a line chart showing the performance of your portfolio alongside a relevant market index would effectively communicate your portfolio’s relative performance.
Troubleshooting Common Issues

Exporting your Google Finance portfolio to Excel can sometimes present challenges. This section addresses common problems and provides solutions to help you successfully transfer your data. Understanding these potential hurdles will streamline the process and prevent frustration. We’ll cover issues ranging from simple formatting problems to more complex API errors.
Data Corruption During Export
Data corruption can manifest in various ways, from missing values to completely garbled information. This often occurs during the export process itself, especially if there are interruptions (e.g., network issues, browser crashes). It’s crucial to ensure a stable internet connection and a reliable export method to minimize this risk.
- Problem: Random missing data points or incorrect values within the exported spreadsheet.
- Solution: Retry the export process. If the problem persists, try a different export method (e.g., if using a third-party tool, switch to a manual copy-paste approach). Verify your internet connection for stability. Consider checking the Google Finance portfolio for any unusual data points that might be causing the issue. If the issue continues, clearing your browser cache and cookies might help.
Incorrect Data Formatting
The exported data might not align with your desired format in Excel. For instance, dates might be incorrectly interpreted, numerical values could be treated as text, or currency symbols might be missing. This usually stems from inconsistencies between the data’s native format in Google Finance and Excel’s interpretation.
- Problem: Dates appear as numbers, currency values lack symbols, or numbers are treated as text.
- Solution: Utilize Excel’s built-in formatting tools. For dates, use the “Format Cells” option to specify the desired date format. For currency, apply the appropriate currency format, including the desired symbol. If numbers are treated as text, you might need to use the “Text to Columns” feature to convert them to numerical values. Alternatively, you can format the columns directly within Google Sheets before exporting.
API Errors and Connection Issues
Google Finance relies on an Application Programming Interface (API) to provide data. Network problems or API limitations can lead to errors during the data retrieval and export process. These errors often manifest as specific error messages.
- Problem: Error messages such as “404 Not Found,” “500 Internal Server Error,” or “Network Error” during export attempts.
- Solution: Check your internet connection. If the problem persists, try again later. The Google Finance API might be experiencing temporary outages. Consider using a different browser or device to rule out local browser issues. For persistent errors, consult Google’s support documentation for potential API limitations or service disruptions.

Tim Redaksi